
Engineering leaders are often asked to “hire faster” and “improve retention” in the same breath, as if those are separate initiatives with separate KPIs. In reality, recruitment and retention are one system. When hiring is treated as a volume activity, retention becomes an expensive afterthought. When hiring is treated as risk management, retention becomes measurable and repeatable.
The right recruitment and retention KPIs tie the two together. This article gives civil engineering presidents and business leaders a practical KPI system you can run like any other operating rhythm, with clear definitions, formulas, ownership, and review cadence.
Why recruitment and retention KPIs should share one dashboard
In civil engineering, a mis-hire is rarely contained to HR. It shows up as:
- Project delivery risk (schedule slips, rework, claims exposure)
- Client confidence risk (inconsistent PM communication, turnover on key accounts)
- Margin erosion (inefficient staffing, overtime, change-order leakage)
- Leadership bandwidth loss (principals pulled back into firefighting)
A KPI system that only measures “time-to-fill” creates the wrong behavior: it optimizes for speed at the expense of fit, evidence, and onboarding discipline.
A better approach is to connect the full chain:
Role definition → Evidence-based selection → Offer acceptance → Onboarding execution → 12-month outcomes
That chain is where you build predictable recruitment and retention performance.
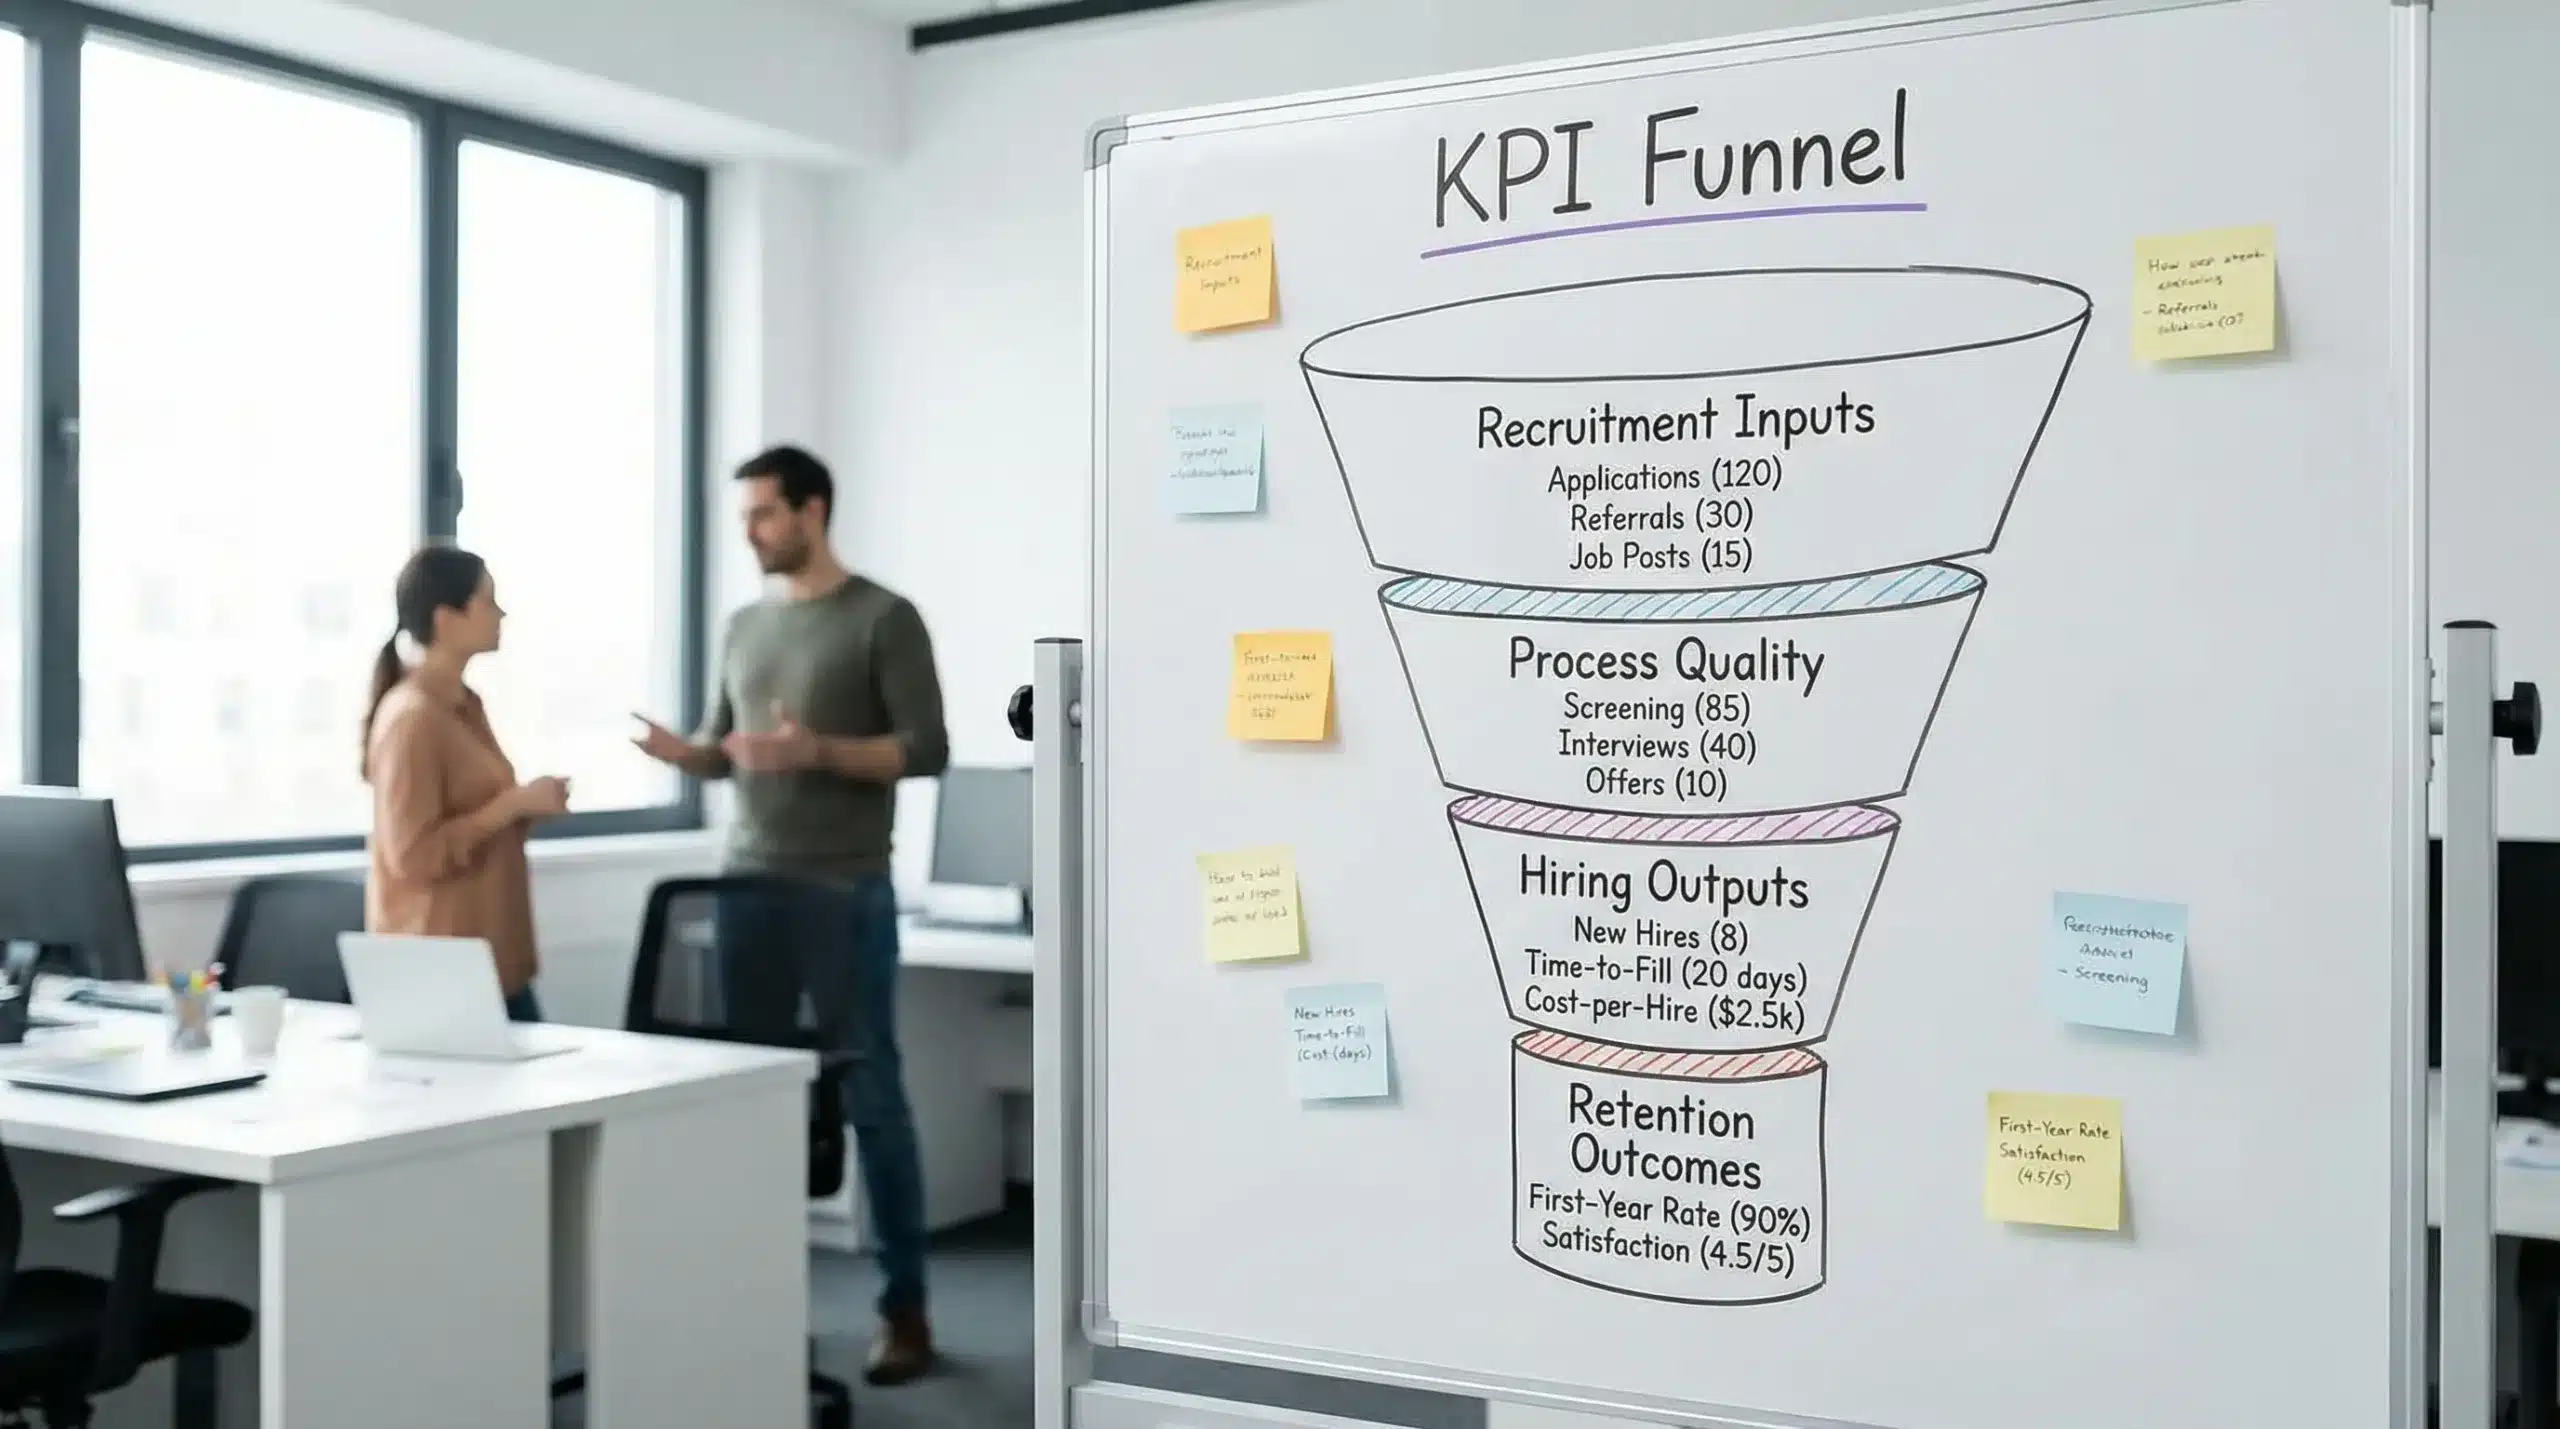
The KPI architecture: four layers that engineering leaders can actually run
A useful KPI system has both leading indicators (you can change them now) and lagging indicators (the business result). Use four layers so you do not confuse activity with outcomes.
Layer 1: Inputs (capacity and market reality)
These KPIs answer: do we have enough recruiting capacity and enough market access for the roles we need?
Examples:
- Requisitions per recruiter (or per hiring lead)
- Calibrated target market size (how many viable candidates exist within your constraints)
- Passive-candidate outreach volume (for leadership and scarce roles)
Why it matters: if inputs are unrealistic, you will “fail” downstream metrics even with a great process.
Layer 2: Process quality (how disciplined your hiring system is)
These KPIs answer: are we running hiring like a governed project or like a series of ad hoc conversations?
Examples:
- Intake quality score (success profile completed, must-have evidence defined, stakeholders aligned)
- Structured assessment coverage (percentage of finalists with consistent evidence packs)
- Time-in-stage (where decisions stall)
Layer 3: Outputs (what hiring produces)
These KPIs answer: what did we deliver this month or quarter?
Examples:
- Offer acceptance rate
- Shortlist-to-hire ratio (a proxy for shortlist quality)
- Slate health (finalists per critical requisition)
Layer 4: Outcomes (business results, including retention)
These KPIs answer: did the hire work, and did they stay?
Examples:
- 90-day time-to-impact (operational ramp, not just “start date”)
- Regretted attrition at 6 and 12 months
- Hiring manager satisfaction tied to objective outcomes (not a vibe check)
Recruitment and retention KPIs: definitions and formulas that prevent “metric theater”
Below is a KPI set engineered for leadership roles and hard-to-fill technical positions in civil engineering. Do not implement all of them at once. Start with 8 to 12 that your team can maintain with clean definitions.
| KPI | What it measures | How to calculate (simple formula) | Why engineering leaders should care |
|---|---|---|---|
| Intake completion rate | Role clarity before sourcing | Completed success profile or RoleDNA™-style map ÷ total new reqs | Most hiring delays and early exits start with role ambiguity |
| Time-to-calibrated shortlist | Speed to decision-ready candidates | Days from kickoff to first shortlist that meets pre-agreed evidence standard | Faster is only good if quality is consistent |
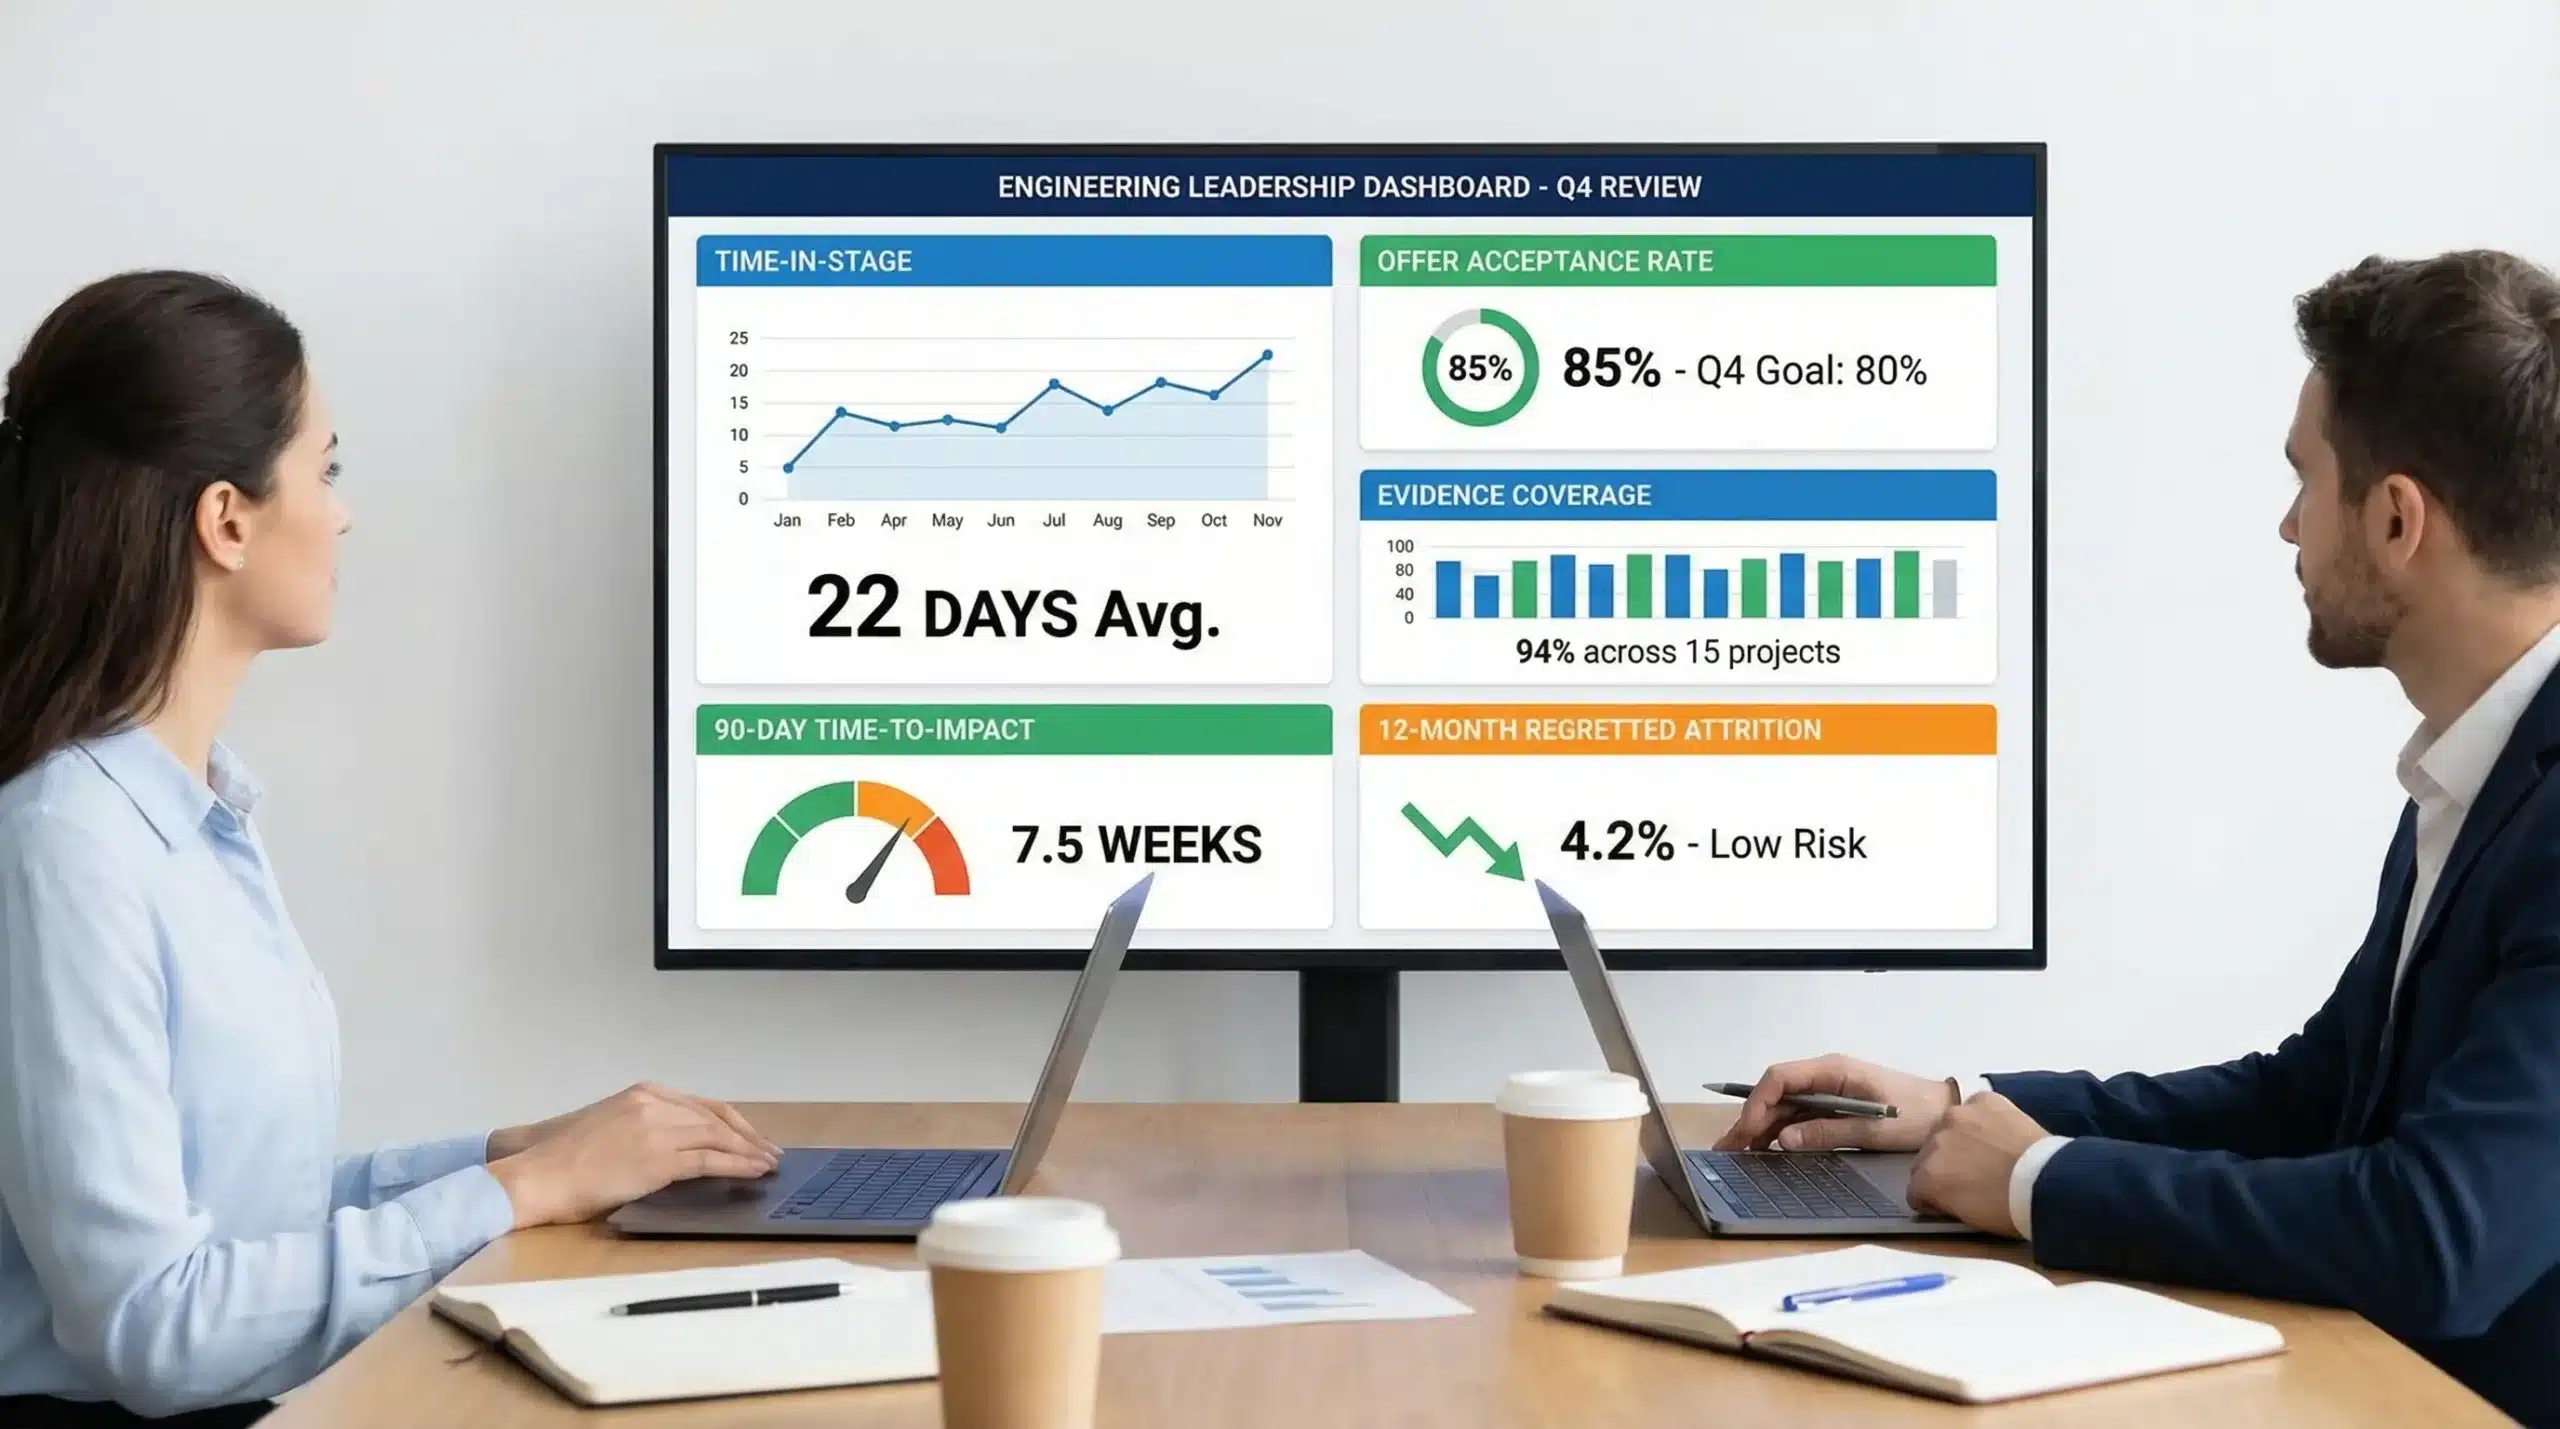
| Time-in-stage | Bottlenecks by step | Average days candidates sit in each stage (screen, interview 1, panel, offer) | Pinpoints where governance fixes beat “more sourcing” |
| Candidate evidence coverage | Whether selection is evidence-based | Finalists with required evidence (work history verification, structured interview scores, references, assessments if used) ÷ total finalists | Reduces mis-hires driven by charisma or resume brand |
| Offer acceptance rate | Offer competitiveness and closing | Accepted offers ÷ total offers extended | Predicts hiring plan reliability and capacity planning accuracy |
| Quality-of-hire (QoH) at 180 days | Whether the hire performs | Hiring manager score + objective milestones met + team feedback (consistent rubric) | Ties selection to delivery outcomes, not just hiring completion |
| Time-to-impact (TTI) | Ramp speed | Days from start date to first predefined value milestone | A stronger metric than time-to-fill for project-driven firms |
| Regretted attrition (6/12 months) | Retention that matters | Voluntary exits you would rehire ÷ total hires in cohort | Separates “natural churn” from costly mismatches |
| Onboarding execution rate | Whether onboarding happened | Completion of 30/60/90 plan milestones ÷ planned milestones | Onboarding is where retention becomes operational, or fails |
| Hiring manager SLA adherence | Leadership discipline in hiring | Interviews scheduled within X days, feedback submitted within Y hours | Speed comes from decision behavior, not recruiter heroics |
| Source mix for critical roles | Reliance on active applicants vs targeted search | % hires from proactive outreach vs inbound | Leadership and niche hires often require passive-market work |
| Cost of vacancy (role-based) | Business cost of empty seats | Estimate using billability, project delay risk, leadership opportunity cost | Helps justify retained search, assessment, and onboarding investment |
Two KPIs to add specifically for civil engineering leadership roles
Many firms measure retention too late or too generically. For senior roles (PMs, discipline leads, operations leaders, regional leaders), add these two:
- Client continuity risk: percentage of key accounts impacted by leadership turnover in the last 12 months.
- Delivery confidence indicator: percentage of active projects where leadership coverage is rated “green” by the delivery leader (a quick monthly pulse).
Those connect people decisions to delivery outcomes your executive team already monitors.
How to set targets without guessing
Targets fail when leaders pick numbers that “sound good” instead of baselining reality. Use this sequence:
1) Baseline first, then improve
Run 60 to 90 days of measurement with minimal judgment. You are establishing:
- Current cycle time by role family
- Where candidates drop (and why)
- Which hiring managers consistently slow decisions
- Your real 6- and 12-month retention by role type
2) Segment your metrics by role risk
A single dashboard for all roles creates noise. Segment at least into:
- Critical leadership roles (high downside risk)
- Scarce technical roles (market constraints)
- Standard delivery roles (more repeatable)
Then set different expectations for time, evidence, and sourcing.
3) Define “retention” precisely
“Retention rate” is often meaningless without definitions. Decide:
- Does retention include involuntary exits?
- Are you tracking regretted attrition separately?
- Are you cohorting by hiring manager, office, and role family?
If two leaders define retention differently, the KPI system will fail in the first executive meeting.
The operating rhythm: how to run recruitment and retention like an engineering system
A KPI system only works if it has cadence and owners.
Weekly: pipeline governance (30 minutes)
Purpose: remove decision friction.
Review:
- Candidates stuck in stage (and who owns the next action)
- Interview scheduling and feedback compliance
- Offer risks on finalists (comp, relocation, licensing, counteroffer likelihood)
Monthly: KPI review (60 minutes)
Purpose: correct the system, not blame individuals.
Review:
- Time-in-stage and SLA adherence trends
- Evidence coverage trends
- Offer acceptance trend and top decline reasons
Quarterly: retention cohort review (90 minutes)
Purpose: close the loop between selection and outcomes.
Review:
- 90/180-day QoH by cohort
- 6/12-month regretted attrition by cohort
- Onboarding execution rate and its correlation to retention
If you do only one thing, do the quarterly cohort review. It is where recruitment becomes a retention engine.
Data you need (and how to keep it clean)
Most engineering firms already have the systems they need, but data is scattered.
Typical sources:
- ATS or recruiting tracker (stages, time-in-stage, source mix)
- HRIS (start dates, exits, tenure)
- Performance check-ins (180-day outcomes)
- Project delivery systems (time-to-impact milestones tied to delivery)
- Finance (recruiting spend, agency fees, relocation, sign-on)
If recruiting costs are fragmented across vendors and entities, it becomes hard to track cost-per-hire or cost-of-vacancy inputs consistently. Some firms solve the finance side by centralizing invoice and reporting workflows in a single finance platform, then reconciling those outputs to recruiting cohorts.
The “KPI-to-action” map: what you change when a KPI is off
KPIs are only valuable if each has a default corrective action.
If time-to-shortlist is slow
Likely causes:
- Role constraints are unrealistic (location, pay band, PE requirement, niche experience)
- Market mapping is thin, relying only on inbound applicants
- Stakeholders are not aligned on must-have evidence
Corrective actions:
- Recalibrate the role with a one-page success profile (outcomes, not duties)
- Expand search geometry (adjacent industries, relocation support, hybrid structure where feasible)
- Use a tighter evidence standard so fewer, better candidates move forward
If offer acceptance is dropping
Likely causes:
- Process speed is too slow (candidates accept elsewhere)
- Compensation story is unclear or inconsistent
- Hiring manager rapport is weak
Corrective actions:
- Add an executive sponsor touchpoint for finalists
- Pre-close earlier (surface concerns before the offer)
- Standardize offer components and approval timing
If 6 to 12-month regretted attrition rises
Likely causes:
- Selection did not test leadership behaviors that matter in your environment
- Onboarding is informal, inconsistent, or overloaded by billability pressure
- Role reality does not match the interview narrative
Corrective actions:
- Improve role mapping (what “great” looks like behaviorally and operationally)
- Implement a non-negotiable 30/60/90 plan with milestone owners
- Add a 30-day “expectations reset” meeting between hire, manager, and an executive sponsor
Where specialist search strengthens the KPI system (without adding bureaucracy)
For presidents and business leaders, the question is not “agency vs in-house” in general. It is whether you have the market access and assessment depth to hit your outcomes for high-risk roles.
Specialist executive search partners typically improve KPI performance when:
- The candidate pool is passive and competitive
- The role is confidential or politically sensitive
- You need consistent evidence (psychometrics, structured referencing, verified achievements)
- You want retention accountability tied to methodology
Alexander Executive Search, for example, positions its process around engineering-specific recruitment and retention outcomes, including structured role mapping (RoleDNA™), psychometric assessments, and tools to quantify mis-hire exposure (see the Bad Hire Calculator). If you already measure the KPIs above, a partner should be able to plug into your dashboard with transparent reporting rather than replacing your operating rhythm.
Frequently Asked Questions
What is the most important KPI that connects recruitment and retention? The most useful connector is 12-month regretted attrition by role family and hiring manager, paired with a leading indicator like onboarding execution rate.
Should engineering firms prioritize time-to-fill or quality-of-hire? For delivery-critical and leadership roles, prioritize evidence-based quality-of-hire and time-to-impact. Speed still matters, but it should be measured as time-in-stage and decision SLAs, not rushed sourcing.
How do you measure quality-of-hire without making it subjective? Use a consistent rubric that combines objective milestones (what the hire delivered by 90/180 days) with structured stakeholder feedback, then compare cohorts over time.
How often should executives review retention metrics? Review leading retention drivers monthly (onboarding execution, early check-ins) and review cohort outcomes quarterly (6/12-month regretted attrition, time-to-impact).
What causes KPI dashboards to fail in practice? The most common failures are inconsistent definitions, lack of segmentation by role risk, and no governance cadence. A KPI without an owner and corrective action becomes reporting noise.
Build a recruitment and retention scorecard that protects delivery
If you want a KPI system that does more than track activity, start by defining what “success” looks like for your highest-risk roles, then enforce evidence-based selection and onboarding governance that you can measure.
If you are hiring mid-management to C-suite leaders in civil engineering, infrastructure, or engineering, and you want stronger retention with transparent, reportable process controls, explore how Alexander Executive Search supports specialist recruitment at .
OUR BLOG
Explore our latest articles
CONTACT US
Change starts with a conversation
Complete the form to get started. We’ll get in touch to discuss our services and your options with you ASAP.